Manly Population Profile: Growing Wealth Inequality
While governments debate housing policy, a decade of data from Manly shows how falling interest rates created a perfect storm, simultaneously enriching property owners and pricing out the next generation of buyers.

This article was originally submitted as part of a postgraduate degree and follows academic referencing conventions.
Sydney is often cited as one of the most liveable cities in the world but it's also one of the most expensive. This is essentially due to high property prices which continue to increase, even during the current pandemic. These rising prices lead to ongoing issues with housing affordability and growing wealth inequality.
While researching a population profile on the Sydney beachside suburb of Manly, it was interesting to note that rapidly increasing housing prices over the last 10 years didn't result in financial stress for home owners. In fact, mortgage repayments significantly decreased (as a percentage of income) thanks to a substantial decline in interest rates. Property owners, therefore, benefited from both decreasing expenses and increasing wealth. Whereas people who were renting found it increasingly difficult to save the deposit to purchase their first home. Their expenses increased (due to higher rents) while there was comparatively little change in their net worth.
This situation of growing wealth inequality due to rising property prices is occurring in many of the world's most expensive cities. Governments fail to address the issue as policies designed to improve affordability are unpopular with home owners, who at this point are the majority of the population. As home owners are unlikely to vote for policies that would see their net worth stagnate or decline, wealth inequality looks to continue to widen.
Having said that, many local government councils are setting targets and proposing changes to planning policies to provide social and affordable housing, including the Northern Beaches Council which governs the suburb of Manly. However, this will have little impact without the support of state and federal governments.
Manly Population Profile
Located on Sydney's Northern Beaches, Manly's 15,866 residents live in an area of 5.6 square kilometres. The population has grown by 1,917 over the 10 years prior to the 2016 census, at a rate of 13.74%, which is lower than the Greater Sydney growth rate where the population increased by 17.11% over the same period. Manly is 15 kilometres from the Sydney CBD and can be reached by ferry in 20 minutes as opposed to driving which takes more than 30 minutes. Manly's harbourside location (Figure 1) and easy access to the Sydney CBD via the ferry at Manly Wharf contributes to the high rate of the population taking the ferry to work at 21.2%. While Manly has medium population density with 2,833 people per square kilometre, this does not take into account 2.77 square kilometres of uninhabited land at North Head, a heritage-listed area within Sydney Harbour National Park. Excluding this area would place Manly's population density at 5,606 people per square kilometre, classifying the suburb as high density, defined as being between 5,000 and 8,000 people per square kilometre.
Figure 1: Map of Manly, NSW
Highly Educated Wealthy Population
The majority of the well-educated population (47.5% have at least a bachelor's degree) who are employed work long hours (58.3% work 40 or more hours per week) mostly in professional or managerial occupations (61.5%), with 68% (Figure 2) of residents in these two occupations working 40 hours or more per week. The education levels and occupations are reflected in the high median weekly household income of $2,449, which is $699 higher than the Greater Sydney median. The correlation between tertiary education, professional and managerial occupations and high income is further supported by the annual ABS publication, Characteristics of Employment. This shows employees with a bachelor's degree or higher having higher median weekly earnings and managers and professional employees having the highest median hourly income for all occupations.
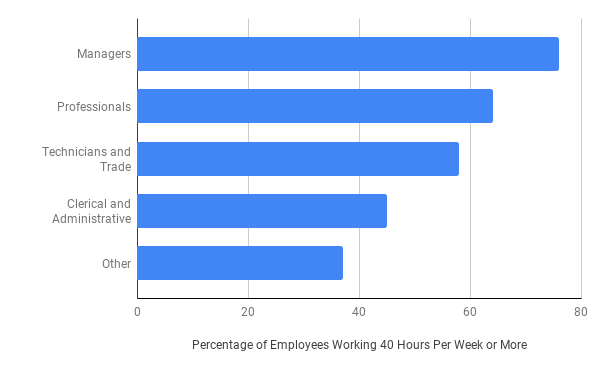
Figure 2: Percentage of Employees Working 40 Hours Per Week by Occupation in Manly, NSW
Skilled Migrant Population
Although Manly is a suburb with comparatively high median household income, this doesn’t translate to higher home ownership with 51% of the population renting in contrast to 34% in Greater Sydney. The difference in the level of home ownership could be attributed to the number of migrants residing in Manly as 80% of skilled migrants in Australia initially live in rental properties and 48.1% of Manly's population was born overseas. While it's unlikely the entire migrant population arrived on skilled migration visas, with the majority of the population working in professional and managerial positions, many of these in the information technology, banking, finance and advertising industries, it suggests a portion have arrived on skilled visas and are therefore highly likely to rent. Occupations in these industries are currently listed as skilled occupations by the Department of Home Affairs, a list published by the federal government on an ongoing basis. However, the skilled occupation list varies over time and the in-demand skilled professions may have been different over the census period from 2006 to 2016. The suggestion that Manly's high rental figures are dominated by skilled migrants is further supported by a government report which states that professionals make up 64.8% of the skilled visa immigration stream and 9.9% were managers.
Lower Costs for the Wealthy
For those who are not renting but have a mortgage on their property, repayments as a percentage of median household income decreased by approximately 18% between 2006 and 2016, from 33% to 27%. Between the 2006 and 2011 census period, median monthly mortgage repayments increased from $2,300 per month to $3,000 per month, an increase of 30%. However, incomes also increased during this period resulting in the proportion of repayments remaining steady at 33% of median household income. The 30% increase in median monthly mortgage repayments could be the result of a range of factors including increasing property prices which typically leads to households taking on more debt to finance the increased cost of housing. Increased borrowing capacity and finance availability could also have contributed, for example, with the rise of low deposit and low documentation loans that occurred in the 2000s. Between 2011 and 2016, median monthly mortgage repayments dropped to $2,882 whereas median monthly household income rose to $10,612. Therefore, by 2016, the proportion of repayments had dropped to 27% of median household income (Figure 3). Standard variable interest rates in August 2006 and August 2011 were 7.8% but decreased to 5.38% by August 2016, the month of the census. This suggests the decrease in mortgage repayments during this period was a factor of interest rates at the time along with an increase in median household income, related to an increase of 3.2% of the population working in professional and managerial occupations as well as wage inflation.
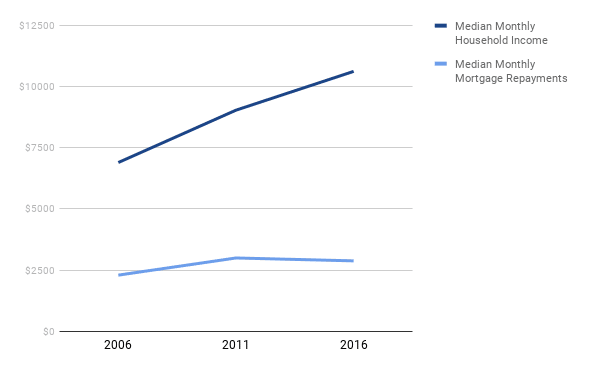
Figure 3: Median Monthly Household Income and Mortgage Repayments in Manly, NSW
Overall, Manly is an affluent suburb of Sydney where a large portion of the population consists of high-income skilled professional workers who live in high-density rental accommodation, close to the ferry, beach and Sydney Harbour National Park at North Head.
References
Australian Bureau of Statistics, 2006. Manly (NSW) (SSC), Basic Community Profile.
Australian Bureau of Statistics, 2011. Manly (NSW) (SSC), Basic Community Profile.
Australian Bureau of Statistics, 2016. Greater Sydney (NSW) (GCCSA), Time Series Profile.
Australian Bureau of Statistics, 2016. Manly (NSW) (SSC), General Community Profile.
Australian Bureau of Statistics, 2019. 6333.0 - Characteristics Of Employment, Australia, August 2019.
Australian Bureau of Statistics, 2020. 3218.0 - Regional Population Growth, Australia, 2018-19.
Deloitte Access Economics, 2011. The Housing Aspirations Of New Settlers To Australia. [online] p.3.
Department of Agriculture, Water and the Environment, 2020. Australian Heritage Database.
Department of Home Affairs, 2020. Skilled Occupation List.
Department of Immigration and Border Protection, 2016. 2015–16 Migration Programme Report.
Transport for NSW, 2020. Trip Planner.
Whitten, R., 2020. Historical Mortgage Interest Rates In Australia.
Yates, J., 2011. Housing in Australia in the 2000s: On the Agenda Too Late?




Comments